Example workflows
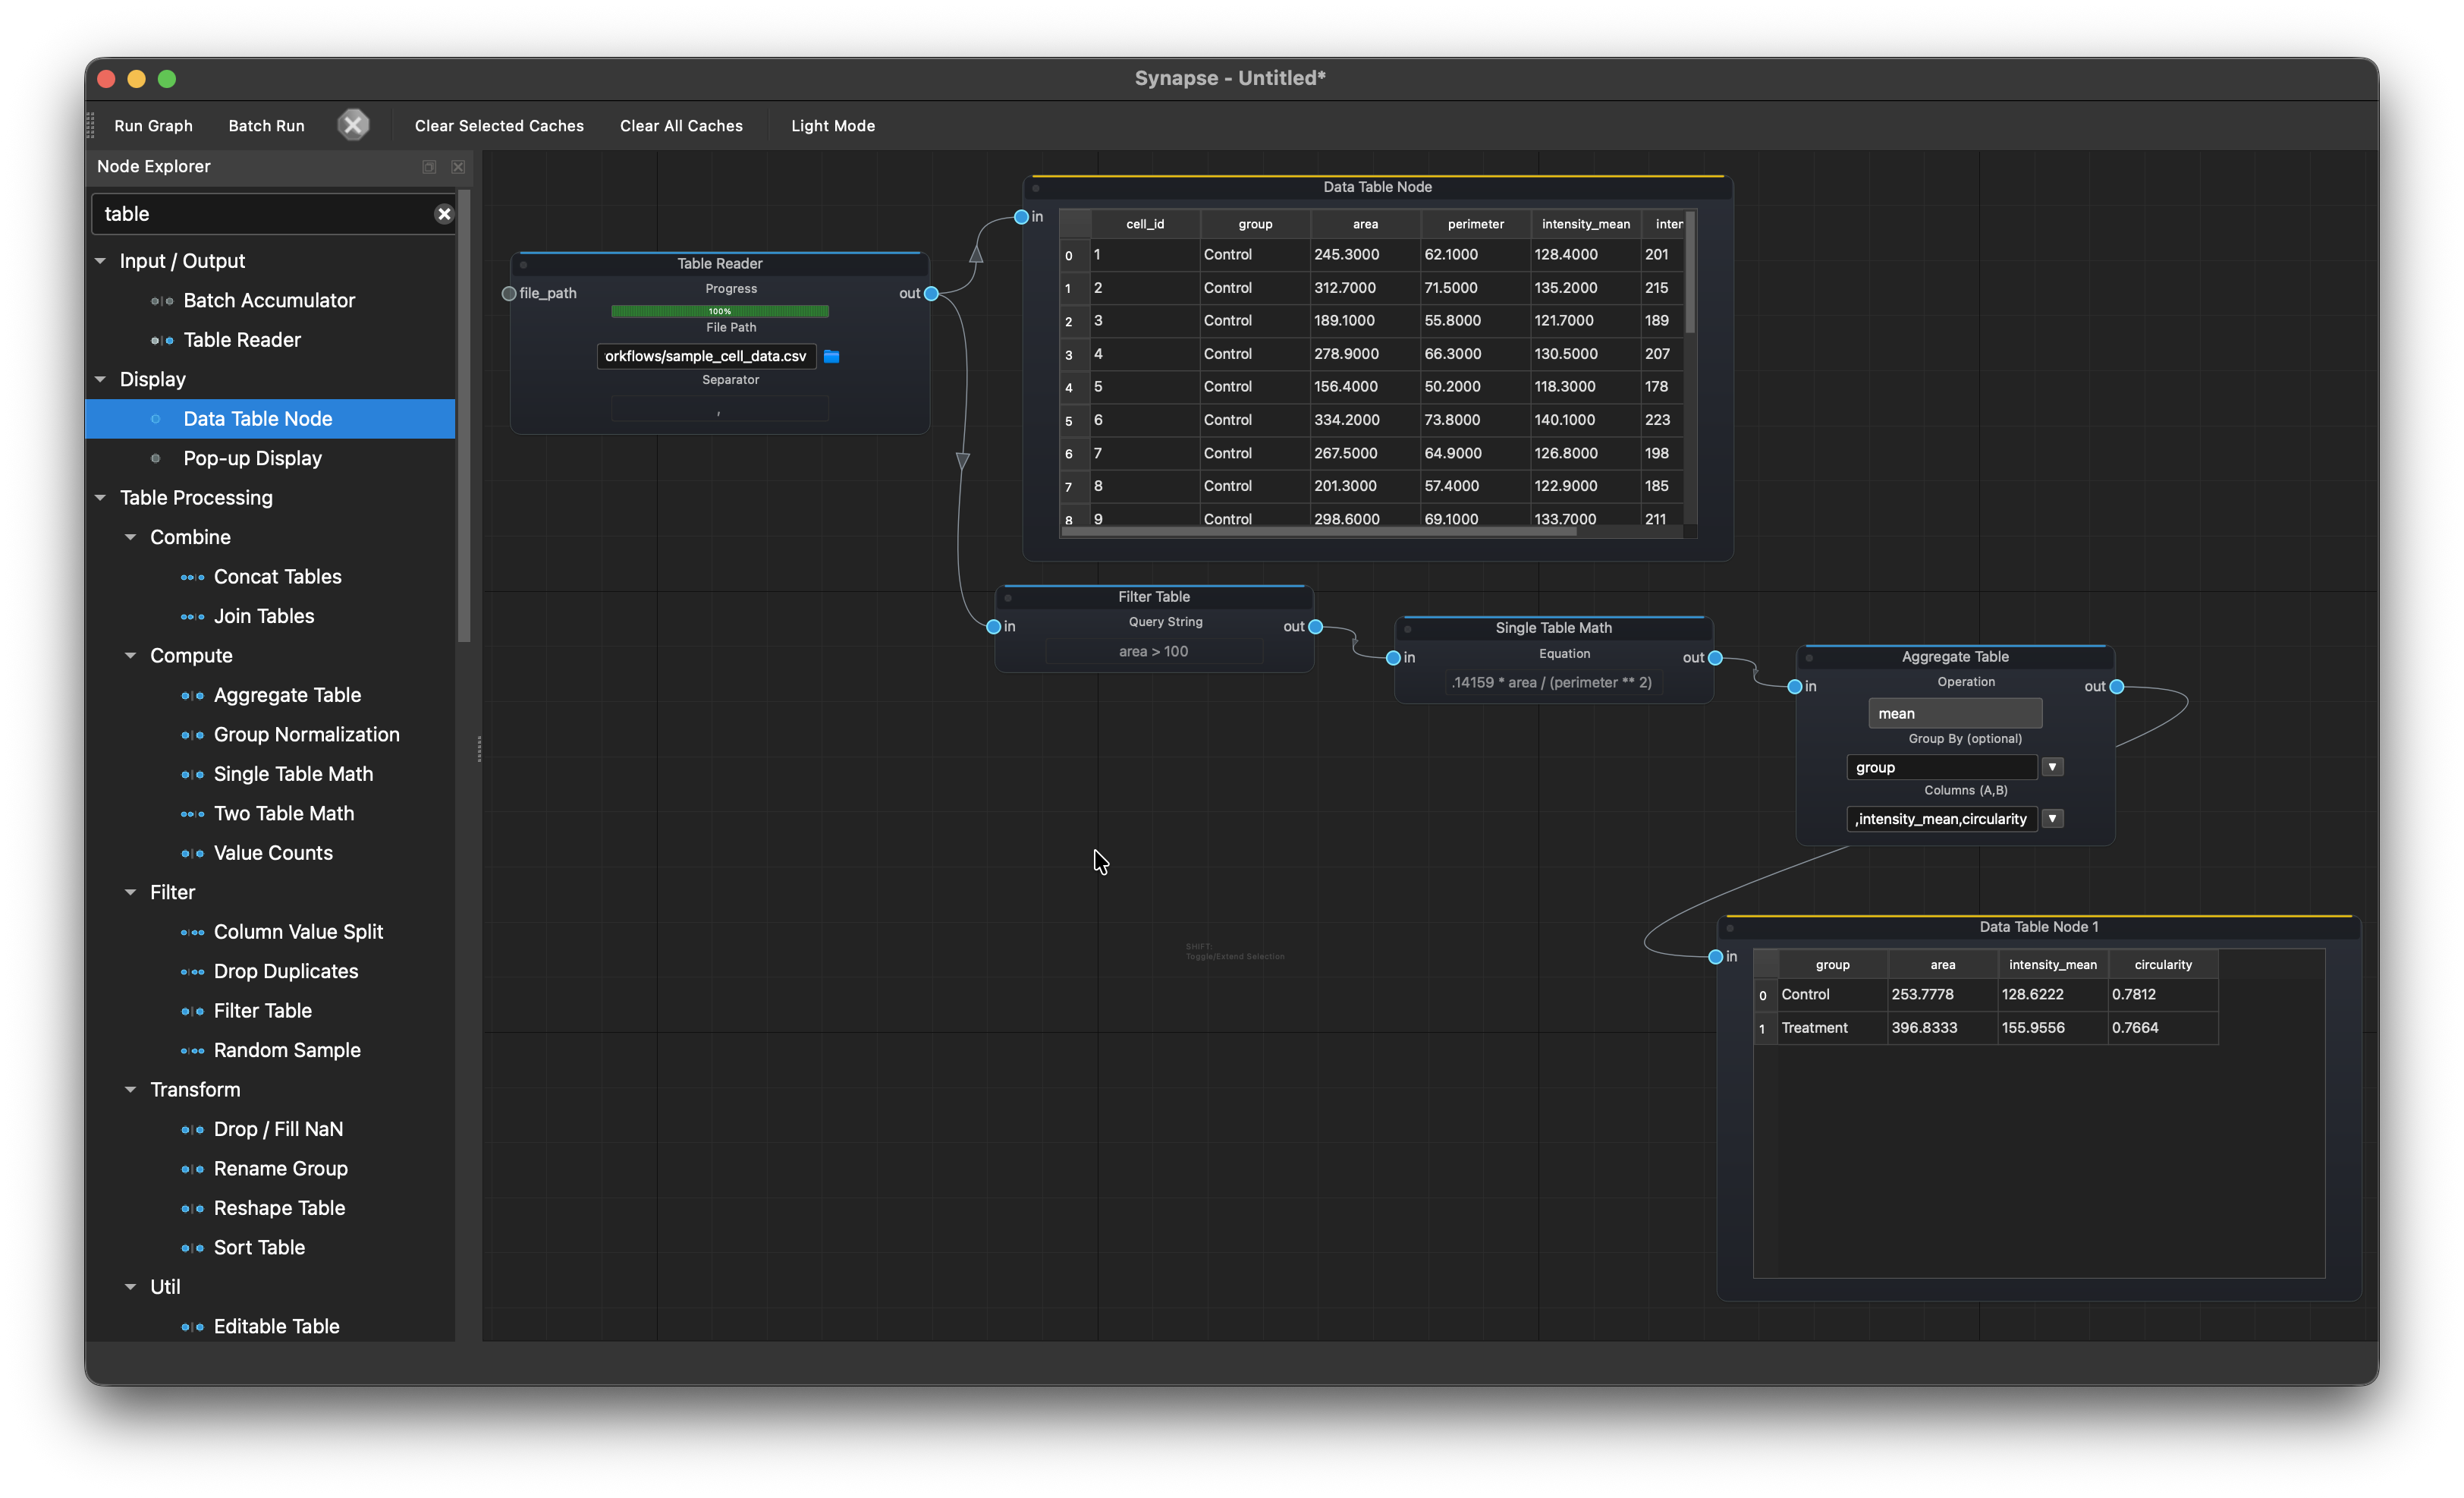
CSV analysis
Table Reader > Filter Table > Single Table Math > Aggregate Table > Data Table Node
Load a CSV of cell measurements, filter out debris (area > 100), compute circularity (4 * pi * area / perimeter^2), aggregate by group to get mean values for Control vs Treatment, and display the summary.
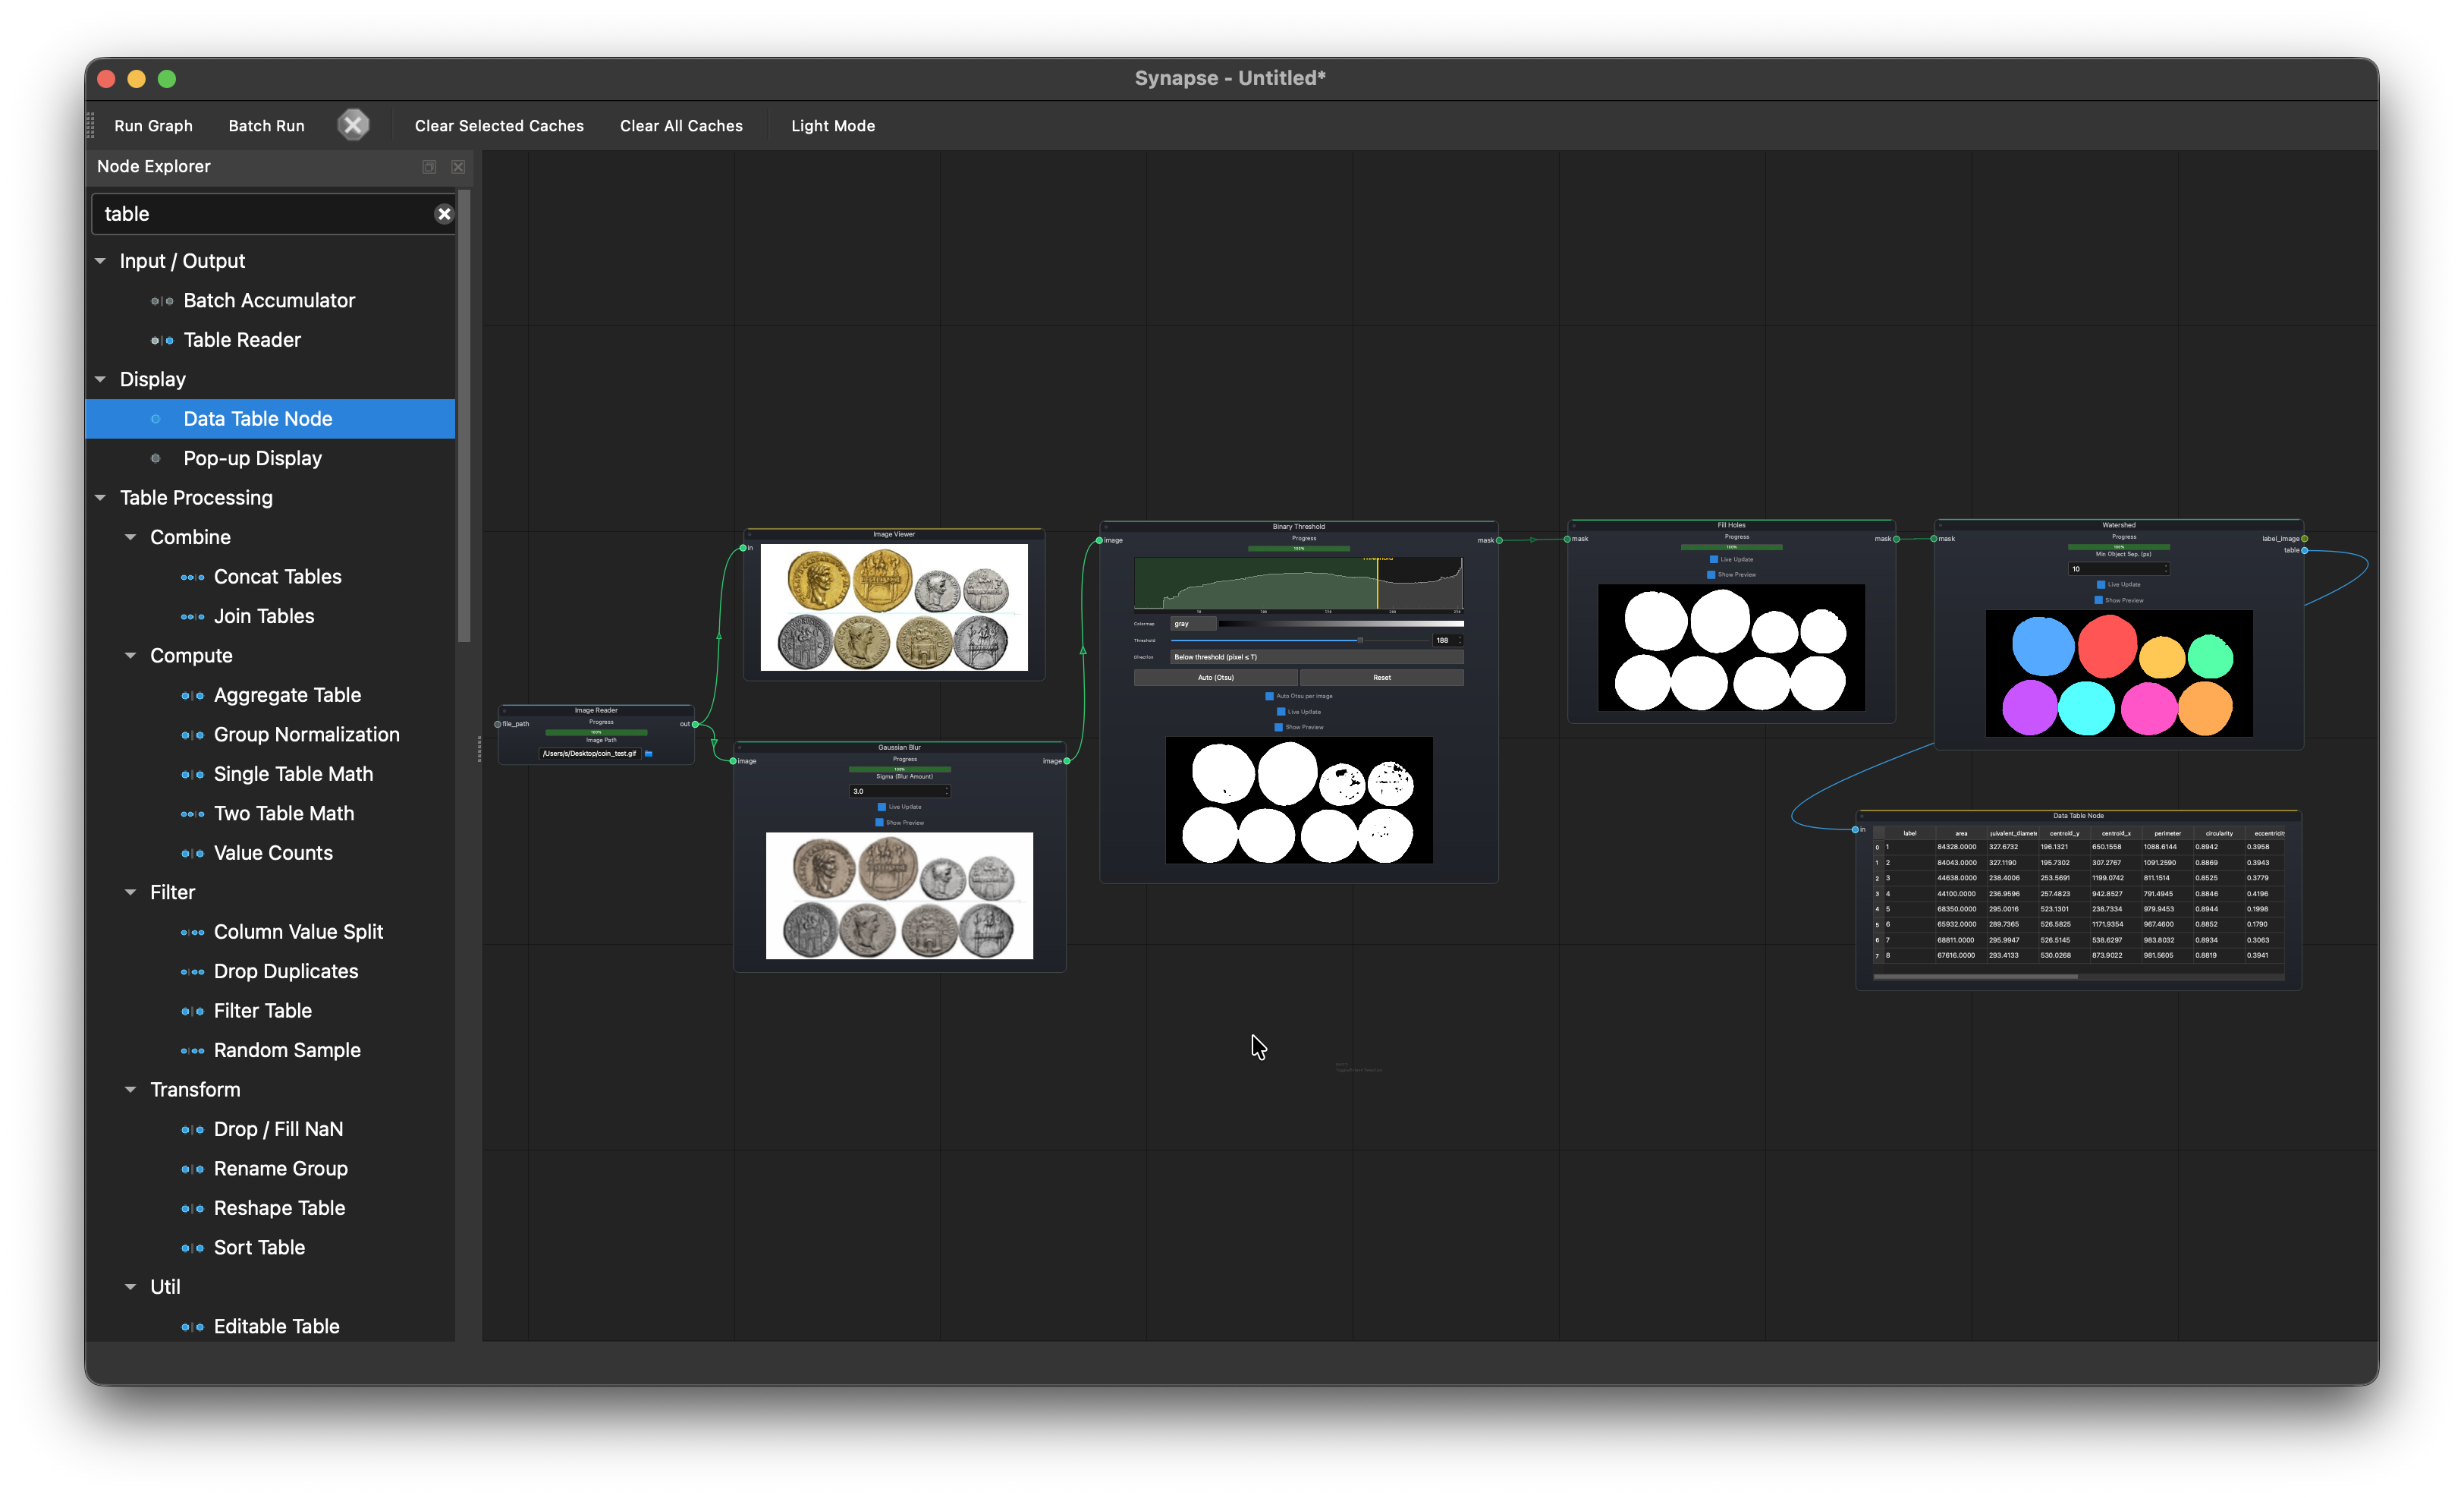
Object detection and measurement
Image Reader > Gaussian Blur > Binary Threshold > Fill Holes > Watershed > Data Table Node
Load a coin image, blur to reduce noise, threshold, fill holes, then watershed to separate touching objects. Outputs area, perimeter, and circularity for each detected object.
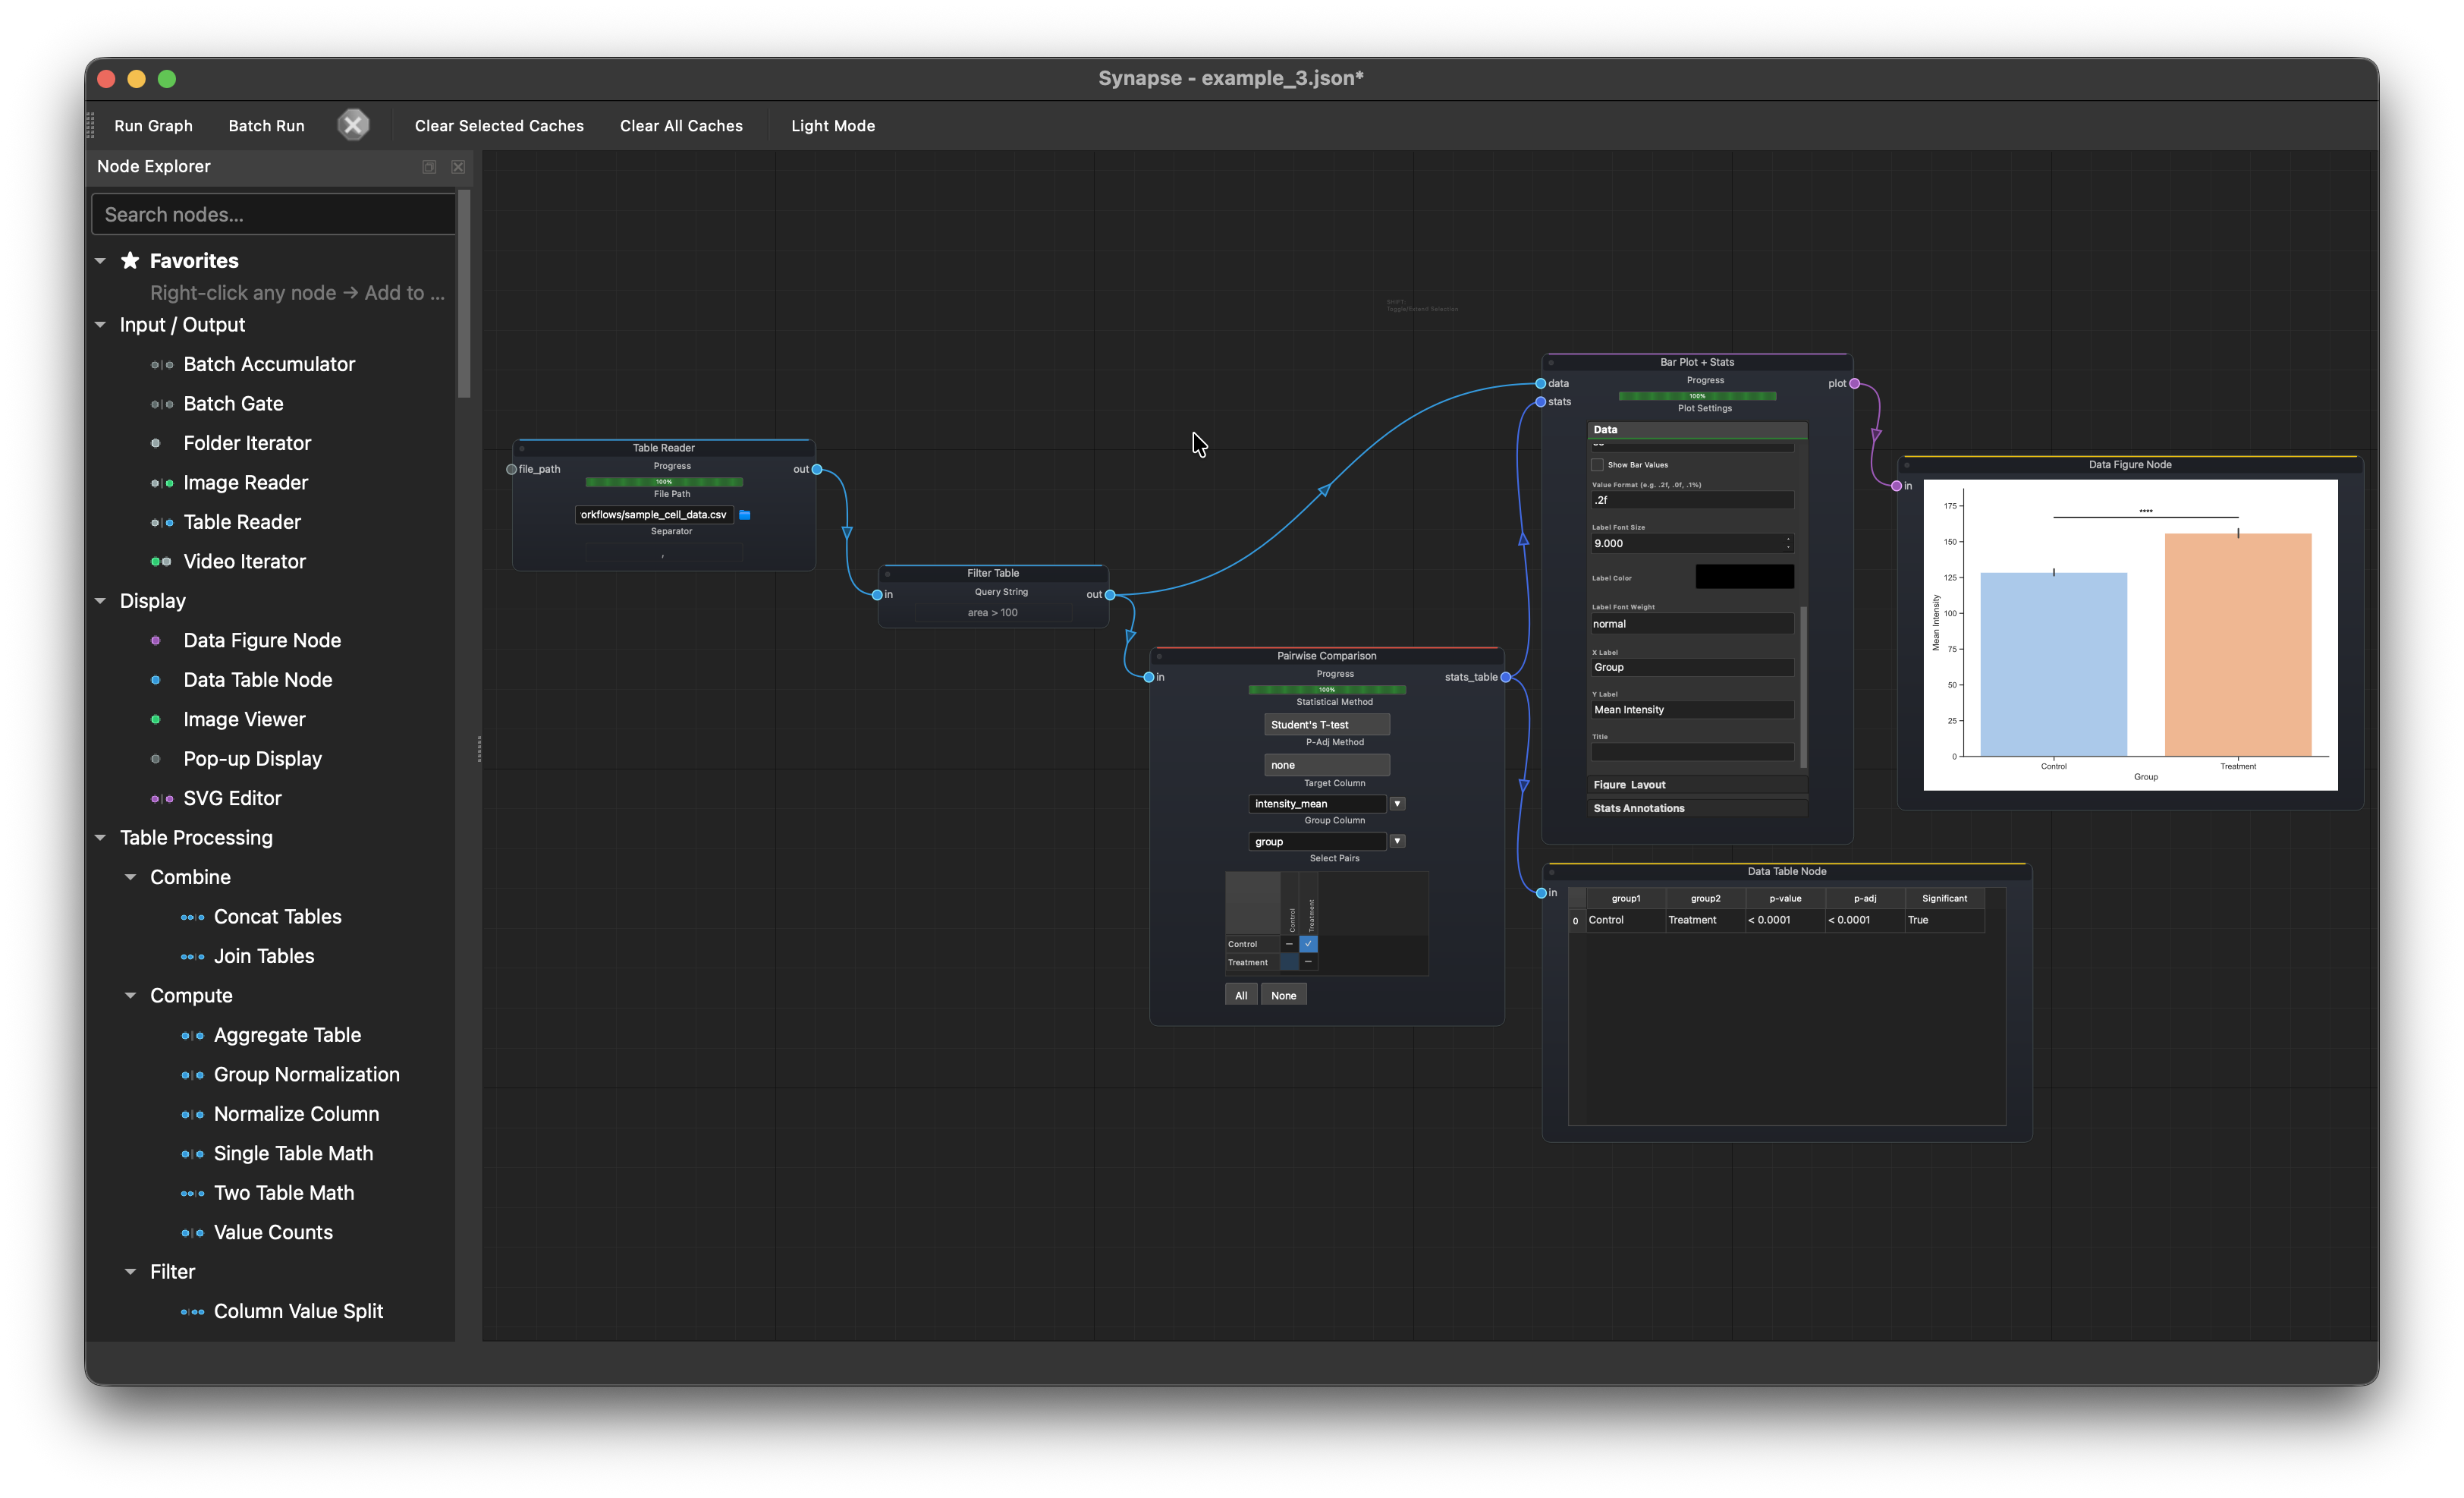
Statistical comparison
Table Reader > Filter Table > Pairwise Comparison > Bar Plot > Data Figure Node
Load cell measurement data, filter out debris, run a pairwise comparison on intensity_mean between Control and Treatment, and plot the result with significance annotations.
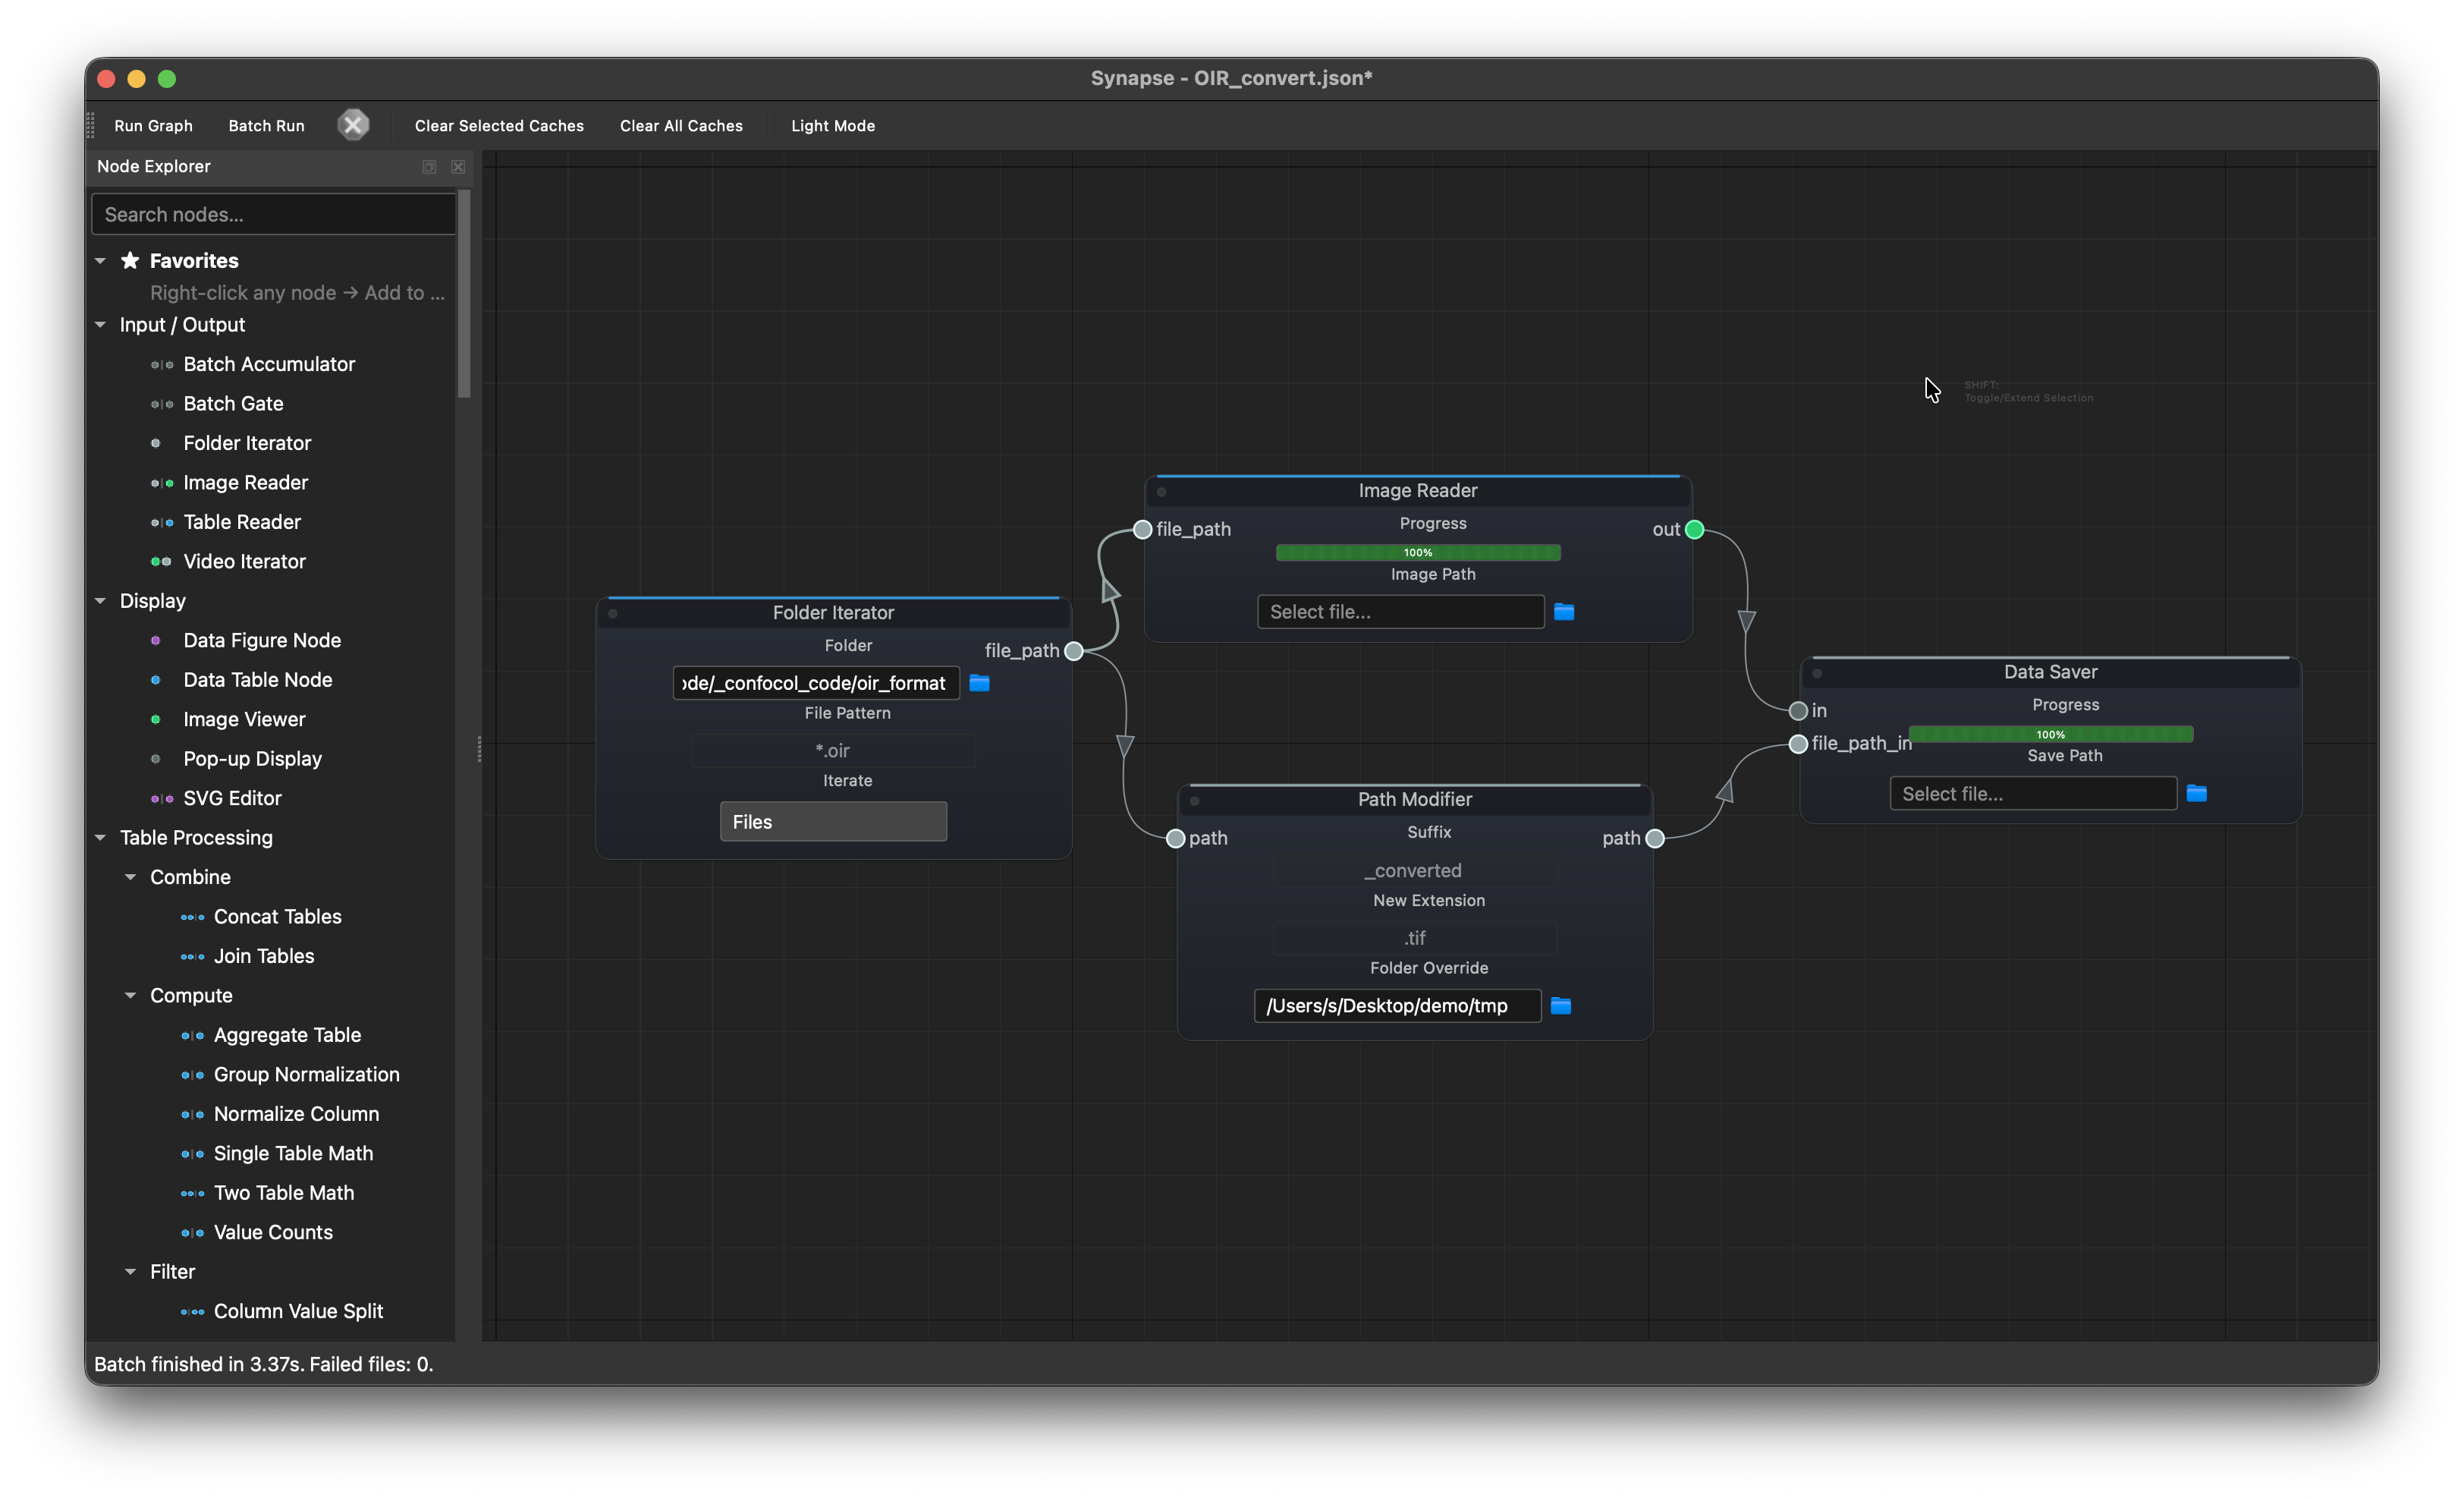
Batch OIR conversion
Folder Iterator --> Image Reader  --> Data Saver
       └---------> Path Modifier -----↗
Batch-convert Olympus OIR microscopy files to TIFF. The iterator feeds each .oir path to both the reader (decodes the image) and the path modifier (swaps the extension to .tif and redirects to an output folder). Both connect to the saver.
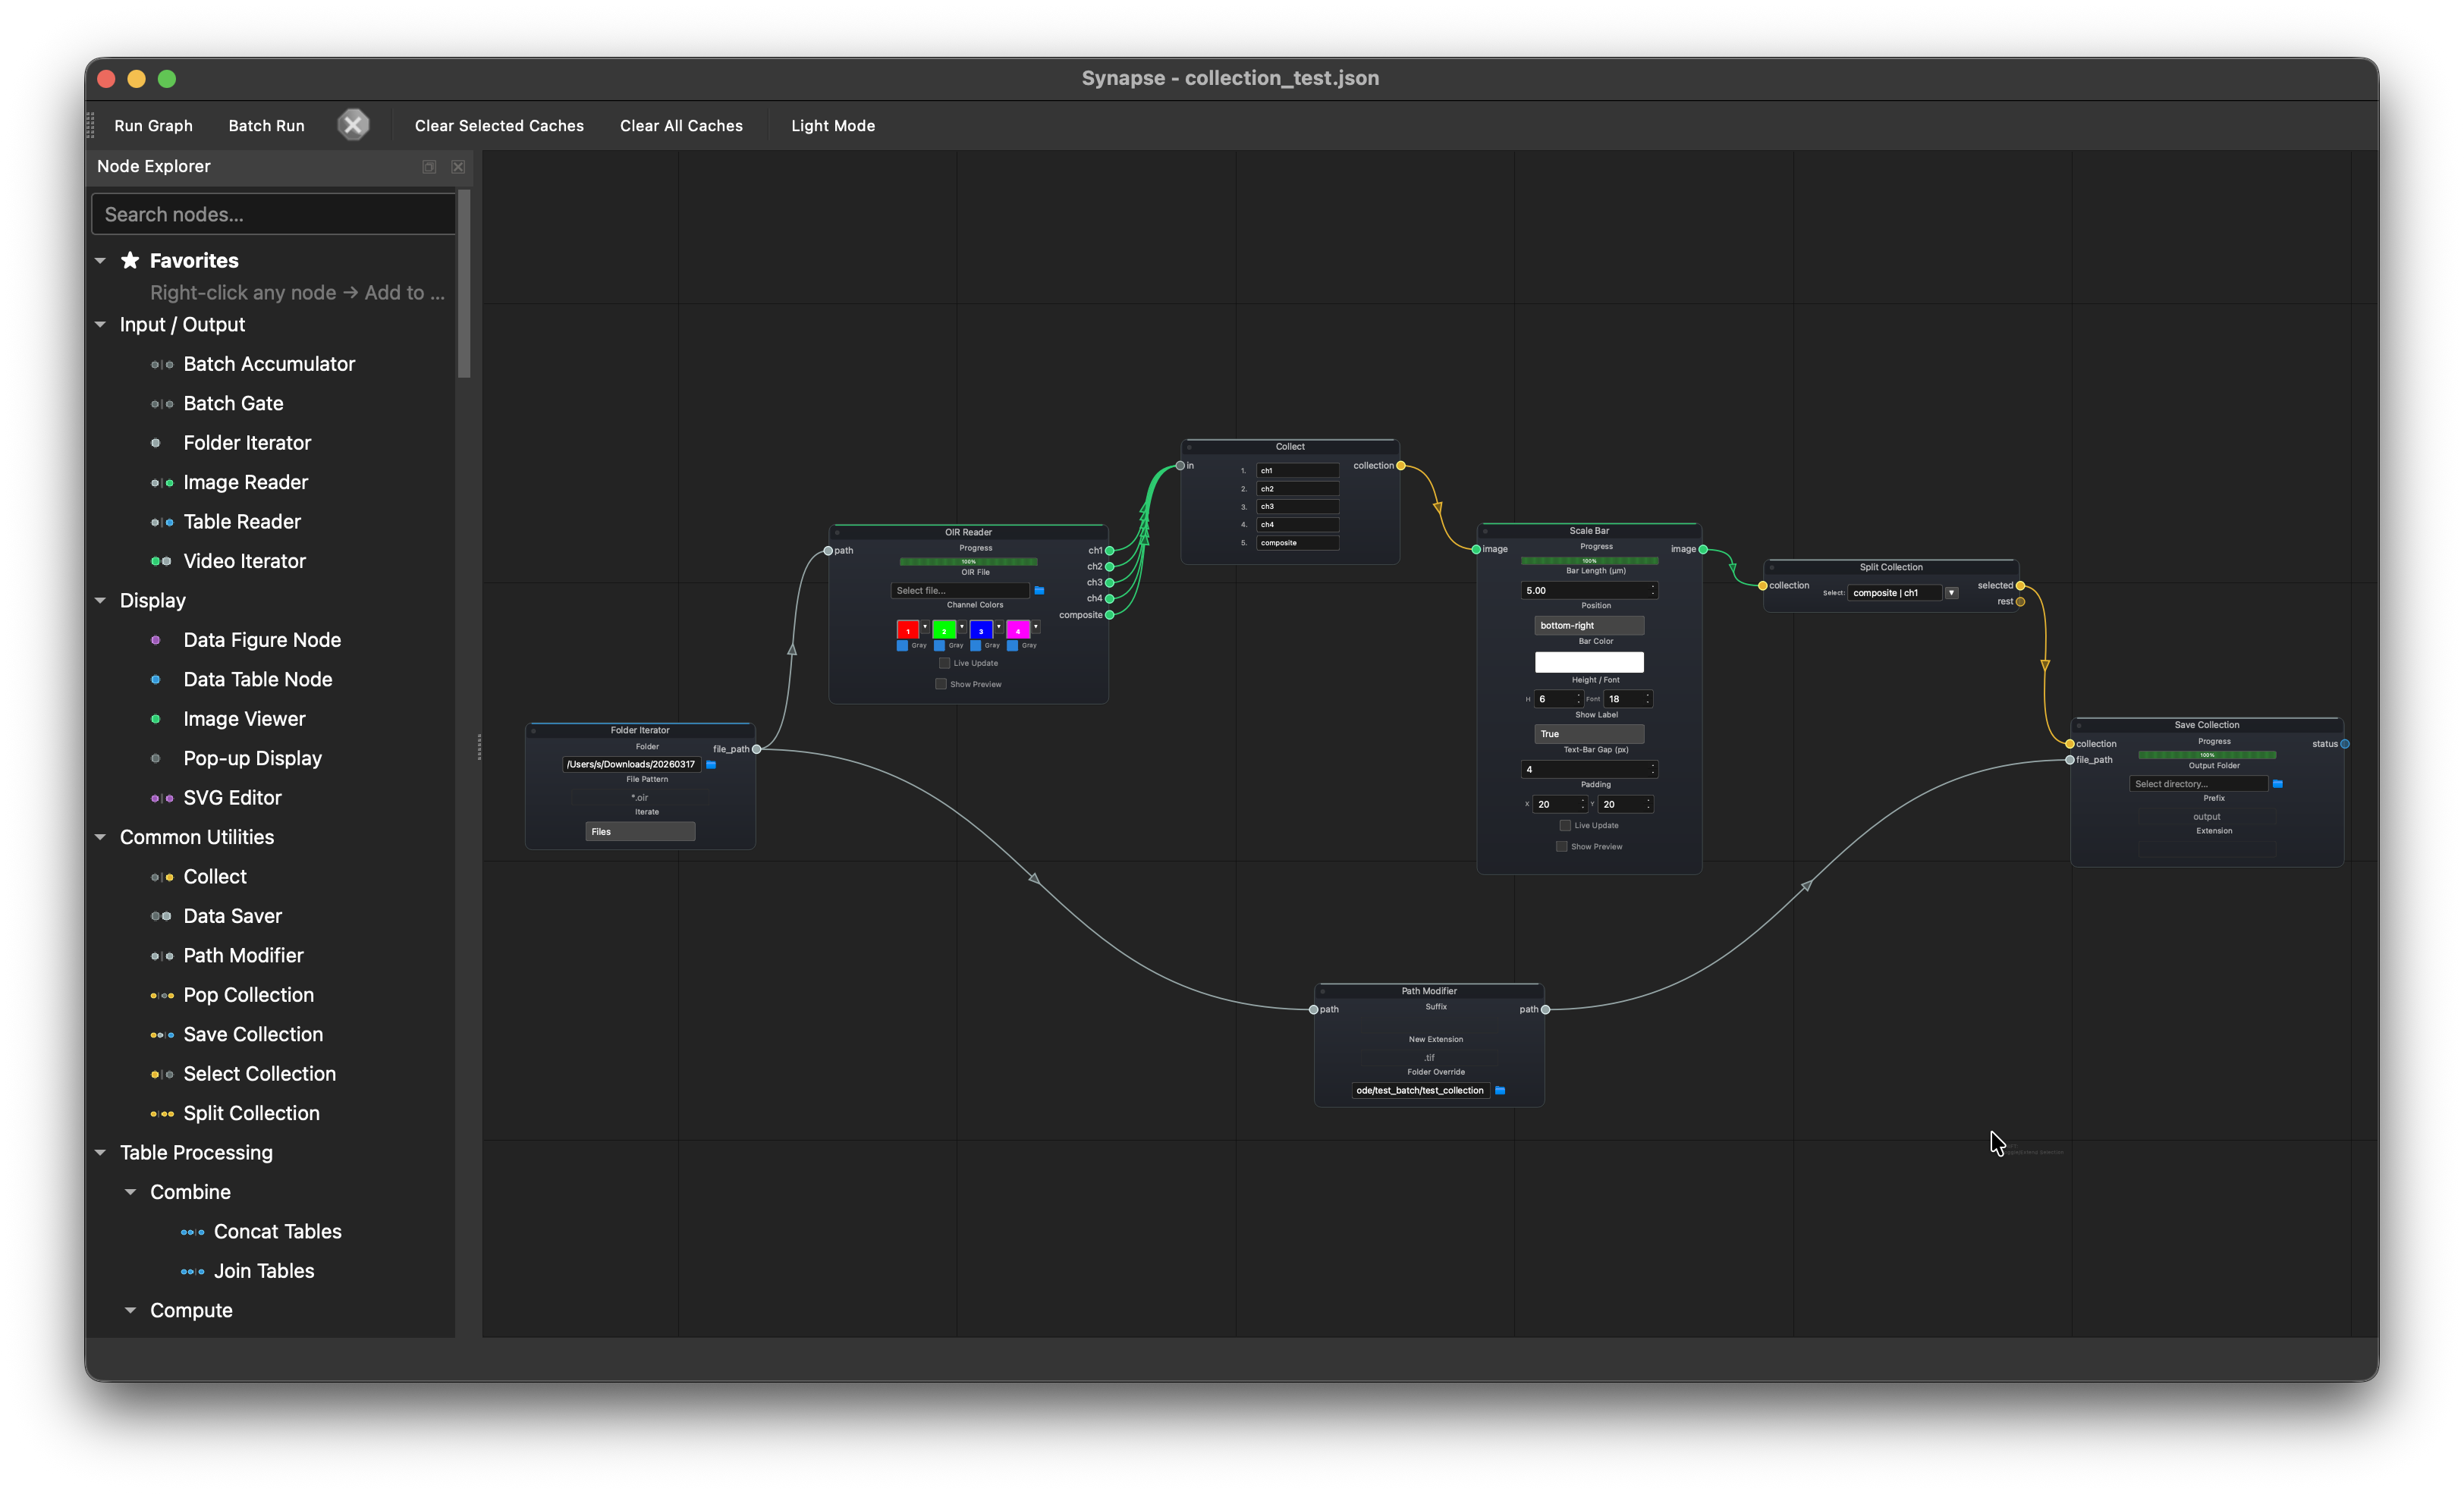
Batch multi-channel export with collections
Folder Iterator --> OIR Reader --> Collect --> Scale Bar --> Split Collection --> Save Collection
       └---------> Path Modifier -----------------------------------------------↗
Batch-process a folder of multi-channel OIR files. The OIR Reader splits each file into individual channels (ch1–ch4) plus a composite. The Collect node bundles all outputs into a single collection. Scale Bar applies the same scale bar to every channel automatically. Split Collection separates the composite and ch1 from others and save them to a output folder with extension both determined by Path Modifier.